America’s Worst Drivers Ranked by State – Where Does Yours Stand?
We’ve got bad drivers everywhere, but does your state rank?
Well, let’s say you’re cruising down the highway, when suddenly – someone cuts you off without signaling, another drifts across lanes while texting, and a third barrels through a red light like it’s optional.
Sound familiar? Whether it’s your usual commute, a family road trip, or just a drive around the block, it can often feel like you’re surrounded by the worst drivers in the country.
Interestingly, research shows that poor driving skills might not be random occurrences. Driving habits that are considered poor can spread across geographic areas just like how accents and local slang spread.
The area where we live significantly influences our driving behavior because certain communities struggle to perform fundamental driving tasks including proper merging and proper signaling.
Even vacation destinations aren’t immune. In fact, they can feel worse. People who feel relaxed and are unfamiliar with roads while being in no hurry tend to create driving chaos.
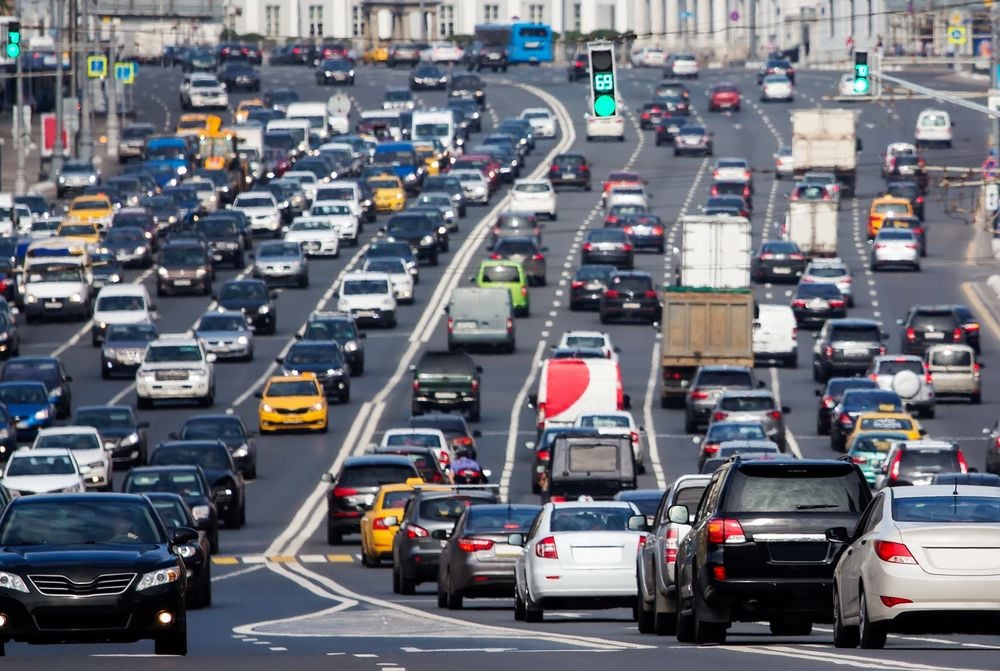
The combination of high population density in cities creates a distinct traffic problem where drivers engage in aggressive behaviors such as following too closely and driving fast while navigating tight urban streets.
But how is this still an issue for Self-Driving cars?
Well, compared to that, self-driving cars function as programmed robots that demonstrate better-driving behavior than human drivers. Self-driving vehicles operate differently from humans because they never take risks at yellow lights or exceed cruise control limits. They stick to the script.
The situation surpasses individual complaints and angry driving incidents because solid evidence exists. A LendingTree study provides data about which states contain the worst and best drivers across the United States.
The report exists to raise awareness rather than to shame anyone according to Rob Bhatt who works as an insurance expert at LendingTree. “It’s about awareness. Driving safely reduces your chances of accidents while simultaneously decreasing your insurance expenses.”
With that said, which state has the worst drivers?
The state with the worst drivers?

Massachusetts takes the lead position in LendingTree’s latest research. The state of Massachusetts led all jurisdictions with 61.1 driving incidents per 1,000 drivers during the study period surpassing both Washington D.C. and every other state.
Following is Rhode Island with 60.6 incidents per 1,000 drivers and California finished as the third highest at 55. The insurance expert Rob Bhatt from LendingTree reveals that Massachusetts holds the record for the most driving incidents across the state.
But how did this ranking come about, you might ask? Well, here is how they determined the worst from the rest.
How did the study determine the states with the worst drivers?
To pinpoint which states had the worst drivers, LendingTree researchers dug into an enormous pool of data. They analyzed tens of millions of insurance inquiries collected between November 5, 2023, and November 4, 2024.
The team used concrete numbers that reflected dangerous driving actions instead of depending on personal opinions or reputations. According to Rob Bhatt who works as an insurance expert at LendingTree “Bad driving can mean different things depending on who you ask.”
Our research concentrated on driver behaviors which scientific studies have proven to cause accidents and injuries such as speeding and driving under the influence.
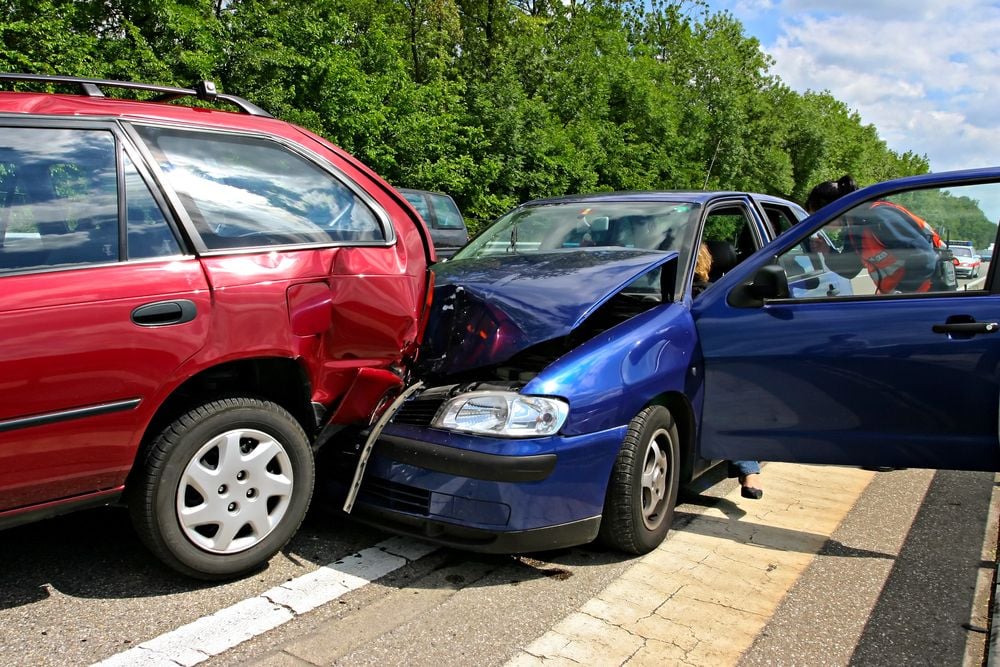
The research examined four main categories which included reported accidents, DUIs, and speeding violations together with various other citations that included failing to yield, improper passing and driving without insurance, and neglecting to signal.
The indicators revealed detailed information about driver conduct throughout each state while identifying which states contained the highest number of risky driving habits.
What Makes Driving in Massachusetts So Challenging?
Massachusetts drivers consistently rank as the worst drivers in the nation due to multiple valid reasons. The local nickname they earned through their infamous reputation cannot be shared publicly but their poor driving behavior extends beyond simple discourtesy.
The state’s driving problems stem from inadequate infrastructure combined with its environmental conditions. The original roads of Massachusetts still guide thousands of drivers through their narrow winding paths although they were built centuries ago when traffic lights and SUVs did not exist.
According to Kate Terry who serves as CEO of Surround Insurance and has lived in Boston for many years the driving experience extends beyond vehicle operation. The conditions we must navigate play an equal role as our driving behavior in creating the state’s driving troubles.
The driving environment in Massachusetts consists of multiple issues such as heavy traffic congestion, old road designs and ongoing construction activities, and harsh weather conditions which create dangerous visibility conditions during day and night.
Combine all of that, and it’s not hard to see why even the most well-meaning driver might end up with a few dings on their record.
Which States Follow Massachusetts for the Worst Drivers?
Massachusetts leads the rankings of states with reckless drivers yet other states share similar driving problems. Multiple states demonstrated concerning driving patterns through their high accident rates, DUI offenses, and speeding violations.
- Rhode Island is in the second position in the rankings by showing 60.6 driving incidents per 1,000 drivers. Massachusetts shares the position of having the second-highest accident rate in the country (39.7) alongside California and ranks alongside Wisconsin for the 13th-highest DUI rate. Speeding incidents in the state stand at position 28 with 2.4 occurrences per 1,000 drivers.
- California ranks as the third best state in the nation for its low speeding violations which total 1.2 incidents per 1,000 drivers. The state also maintains the second-lowest DUI rate at 3.5 incidents per 1,000 drivers.
- The District of Columbia stands as the fourth worst state according to these statistics. The District of Columbia maintains the lowest speeding incidents at 0.8 but shows the highest DUI rate (3.6) alongside the fourth-highest accident rate at 31.9.
- New Jersey holds the fifth position with 45.8 total incidents that occur per 1,000 drivers. The state holds position number five regarding accidents (30.4) and DUIs (2.5) and shares fifth place with Massachusetts for speeding incidents (1.3 per 1,000 drivers).
How do the rest of the states rank?
Here’s a look at how all 50 states stack up, ranked from worst to best based on the number of reported driving incidents for every 1,000 drivers. This includes things like accidents, DUIs, speeding tickets, and other issues that can signal risky driving behavior.
- Massachusetts: 61.1 incidents
- Rhode Island: 60.6 incidents
- California: 55 incidents
- District of Columbia: 54.6 incidents
- New Jersey: 45.8 incidents
- North Carolina: 39.6 incidents
- Washington: 37.4 incidents
- Maryland: 34.9 incidents
- North Dakota: 34.7 incidents
- Utah: 32.1 incidents
- Idaho: 31.2 incidents
- Nebraska: 29.5 incidents
- Tennessee: 29.3 incidents
- Iowa: 29.2 incidents
- Wisconsin: 28.8 incidents
- Indiana: 28.3 incidents
- Kansas: 28.3 incidents
- Oregon: 27.7 incidents
- South Carolina: 27.7 incidents
- Nevada: 27.6 incidents
- Maine: 26.7 incidents
- Virginia: 26.5 incidents
- Hawaii: 26.3 incidents
- Delaware: 26.2 incidents
- Ohio: 26 incidents
- Connecticut: 25.8 incidents
- Missouri: 25.4 incidents
- Montana: 25.3 incidents
- Minnesota: 24.8 incidents
- South Dakota: 24.7 incidents
- Texas: 24.7 incidents
- Wyoming: 24.6 incidents
- Colorado: 24.5 incidents
- Georgia: 24 incidents
- Florida: 23.8 incidents
- New Mexico: 23.4 incidents
- Pennsylvania: 23.3 incidents
- Alabama: 22 incidents
- New Hampshire: 21.8 incidents
- Arizona: 21.5 incidents
- New York: 21.5 incidents
- Mississippi: 21.2 incidents
- Louisiana: 19.4 incidents
- Illinois: 19.3 incidents
- West Virginia: 18.4 incidents
- Alaska: 17 incidents
- Oklahoma: 15.9 incidents
- Kentucky: 15.8 incidents
- Vermont: 15.5 incidents
- Michigan: 15.3 incidents